For my project, I decided to bake heart-shaped cookies of electrocardiogram readings. An electrocardiogram (ECG or EKG) graphically records the electrical signal of the heart to examine different heart conditions. This is how abnormal heart rhythm can be detected. It is the composite of all action potentials at a given time. I chose to show and describe eight different ECG readings.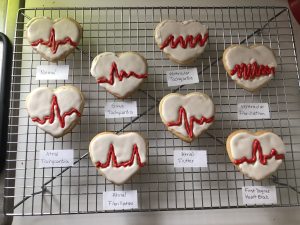
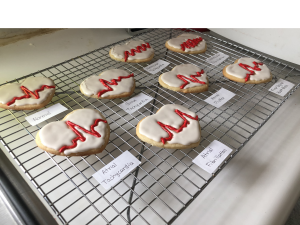
Just by looking at your cooking I’m able to easily identify the different identified beats in the ECG. In your cookies you can clearly see your atrial depolarization or P waves, you can tell where the obvious apex and QRS complexes are higher than the other beats, and I can tell when the repolarization starts at the end of the cookies. What I found extremely interesting was that you were able to recreate multiple electrocardiograms for different cardiac situations like ventricular fibrillation, atrial tachycardia, and a normal sinus rhythm. I like how you chose cookies to depict this objective, last semester I did cookies to depict the different categories of cells and tissues within the body, I think it was a well decided artistic choice that served you very well in accuracy.