
The learning objective that I am addressing in this paper is: “Explain how the heart translates an electrical signal to a contraction” I will be looking at how you can use a 12 lead Electrocardiogram (ECG) to detect a ST- segment elevation myocardial infarction (STEMI) and predict where the ischemia is in the heart and why this is important.
An ECG is a graphic recording of the electrical activity in the heart. It shows all action potentials happening at any one time in the heart. This is done by placing electrodes at various places on the body to measure voltage differences in the heart. Because the heart beats as a unit you can use the ECG to look at what is happening in the heart. The ECG consists of five waves (P,Q,R,S, and T) that correspond to different phases of the beating of the heart. The P wave represents atrium depolarization. The QRS complex corresponds to the depolarization of the right and left ventricles and the T wave represents the re-polarization of the ventricles. If the ST segment is elevated it is a good indication of damaged heart tissue known as a myocardial infarction (MI) commonly known as a heart attack.
Studies have shown that limiting the time from first contact with the health care system and the initiation of reperfusion therapy is crucial in the survivability of patients with a STEMI. “Time equals Muscle” the quicker someone with a MI gets to the Cardiac Catheterization lab the better the outcome. (STEMI, 2022) One study of 6,209 patients with STEMI showed an increase in mortality at a rate of 10% for each hour delayed. (Nielsen et al., 2011) In another study they showed an appreciable decline in STEMI rates from 1997 to 2005 (McManus et al., 2011)
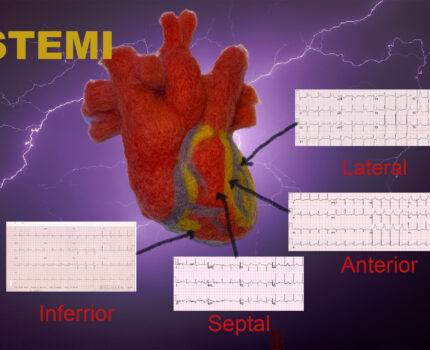
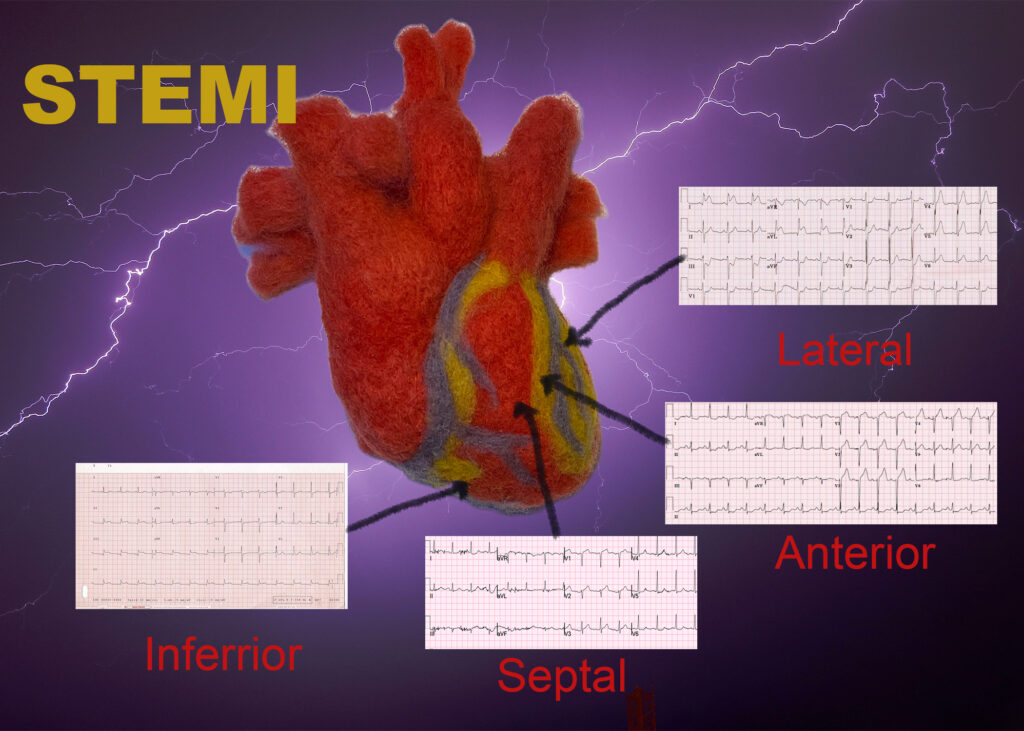
Not only can you identify a STEMI in the field with a 12 lead ECG but you can show what part of the heart is being effected by the heart attack. The leads on a ECG are divided into regional areas that show specific coronary arteries. By analyzing which leads the ST elevation is in you can predict which coronary artery is effected in what part of the heart. Knowing which part of the heart is effected can inform which interventions the cardiologist or paramedic may take to help stabilize the patient. If the ST segment is elevated in leads II, III and aVF the STEMI is in the inferior portion of the heart perfused by the right coronary artery. If the STEMI is in the anterior region caused by the occlusion of the left anterior descending artery it will have ST-elevation in V3 and V4. ST-elevation in V1 and V2 is called a septal STEMI because it looks at the interventricular septum. If the lateral wall of the left ventricle is effected an ST-elevation will show in leads I, aVL, V5 and V6. This large part of the heart is fed by the left anterior descending and the left circumflex arteries.
For my steam project I made a needle felted model of the human heart and showed the region of the heart effected as shown in different ECG rhythm strips. On my model you can see the different coronary arteries effected by the different
References
McManus, D. D., Gore, J., Yarzebski, J., Spencer, F., Lessard, D., & Goldberg, R. J. (2011). Recent Trends in the Incidence, Treatment, and Outcomes of Patients with STEMI and NSTEMI. The American Journal of Medicine, 124(1), 40–47. https://doi.org/10.1016/j.amjmed.2010.07.023
Miedema, M. D., Newell, M. C., Duval, S., Garberich, R. F., Handran, C. B., Larson, D. M., Mulder, S., Wang, Y. L., Lips, D. L., & Henry, T. D. (2011). Causes of Delay and Associated Mortality in Patients Transferred With ST-Segment–Elevation Myocardial Infarction. Circulation, 124(15), 1636–1644. https://doi.org/10.1161/circulationaha.111.033118
Nielsen, P. H., Terkelsen, C. J., Nielsen, T. T., Thuesen, L., Krusell, L. R., Thayssen, P., Kelbæk, H., Abildgaard, U., Villadsen, A. B., Andersen, H. R., & Maeng, M. (2011). System Delay and Timing of Intervention in Acute Myocardial Infarction (from the Danish Acute Myocardial Infarction-2 [DANAMI-2] Trial). The American Journal of Cardiology, 108(6), 776–781. https://doi.org/10.1016/j.amjcard.2011.05.007
STEMI. (2022). Default; Cerkship Directors in Emergency Medicine. https://www.saem.org/about-saem/academies-interest-groups-affiliates2/cdem/for-students/online-education/m3-curriculum/group-electrocardiogram-(ecg)-rhythm-recognition/stemi
Terkelsen, C. J. (2010). System Delay and Mortality Among Patients With STEMI Treated With Primary Percutaneous Coronary Intervention. JAMA, 304(7), 763. https://doi.org/10.1001/jama.2010.1139
Terkelsen, C. J., Lassen, J. F., Nørgaard, B. L., Gerdes, J. C., Poulsen, S. H., Bendix, K., Ankersen, J. P., Gøtzsche, L. B.-H., Rømer, F. K., Nielsen, T. T., & Andersen, H. R. (2005). Reduction of treatment delay in patients with ST-elevation myocardial infarction: impact of pre-hospital diagnosis and direct referral to primary percutanous coronary intervention. European Heart Journal, 26(8), 770–777. https://doi.org/10.1093/eurheartj/ehi100
Dwayne’s visual is a great model of the heart with charts indicating how different regions of the heart effected by ischemia can show up on an ECG. An ECG allows the electrical activity in the heart to be visualized. Dwayne notes that a STEMI can be identified with an ECG and it can be determined if the inferior, septal, anterior, or lateral section of the heart is effected. The sooner the effected area is located, the sooner the immediate treatment of the condition can be determined in order to stabilize the patient.