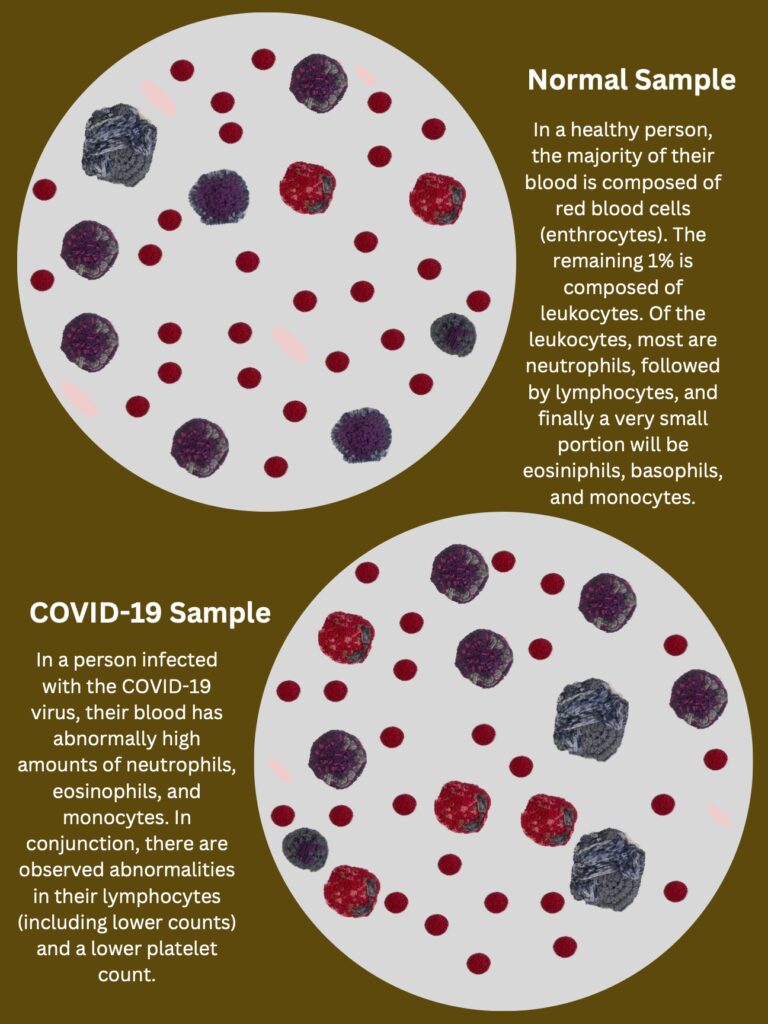
Below is a graphic detailing the components of blood. Each element was hand crocheted and then imported to the computer to create a view of blood under the microscope. The graphic investigates the differences of blood and its components among healthy and individuals diagnosed with COVID-19.
![](https://humanap.community.uaf.edu/wp-content/uploads/sites/848/2024/04/STEAM2024RW-768x1024.jpg)
![](https://humanap.community.uaf.edu/wp-content/uploads/sites/848/2024/04/STEAM2024RW2-768x1024.jpg)
![](https://humanap.community.uaf.edu/wp-content/uploads/sites/848/2024/04/STEAM2024RW3-768x1024.jpg)